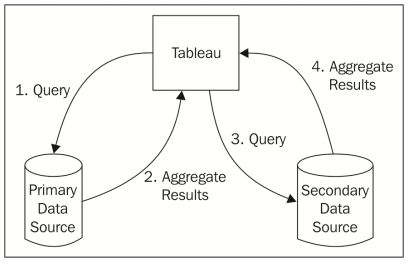
Data Blending allows using data from different data sources in a view. The view is nothing but a chart in Tableau.
Basically, Blending executes a query on each data source and joins the aggregated results.
Tableau Blending classifies Data sources into: Primary and Secondary Data Sources.
Primary Data Source (PDS) – Only one PDS per view. There are some recommendations and mandates for it. They are:
- If any one of the data sources is cube then that should be the PDS.
- Smaller and Faster data source as PDS gives better-performing View.
- If your sources don’t fall under any of the above two categories then whichever source you first use in your view becomes the PDS
Secondary Data Source (SDS) – There could be any number of SDS.
Left Outer Join is default join between PDS and SDS but still it can be changed to left, right and inner joins.
Note: Full outer join is not possible using blending.
Example Use Case:
Sales data collected in an Oracle database and Sales Goal data in an Excel spreadsheet. To compare actual sales to target sales, you can blend the data based on common dimensions to get access to the Sales Goal measure.

