Tableau LOD explained with Simple example

Scope of any Calculations or Aggregate functions is limited to the dimensions that are used in the View or Worksheet. Tableau LOD feature is basically for overriding that limitation.

There are basically three types of LOD Expressions,

  1. Fixed – Fixing/Hard-coding the scope, not influenced by the dimensions in View or Worksheet
  2. Exclude – Exclude the granularity, used to get rid of one or more dimensions in View or Worksheet
  3. Include – Include the granularity, dimension which is not part of the View or Worksheet can still be added to the calculation using Include expression.

Enough theory, let’s jump on to a simple example.
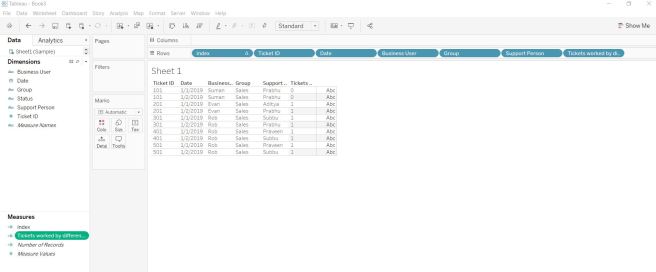
Sample Data:

Employee Year Cycle Reason Incentive
Emp_101 2020 Jan Company Performance 1000
Emp_101 2019 Jan Individual Performance 950
Emp_101 2019 Mar Individual Performance 950
Emp_101 2019 Oct Individual Performance 950
Emp_101 2018 Jul Company Performance 900
Emp_201 2020 Jan Company Performance 700
Emp_201 2020 Mar Individual Performance 375
Emp_201 2019 Mar Individual Performance 675
Emp_201 2018 Jul Individual Performance 650
Emp_301 2020 Jan Company Performance 800
Emp_301 2020 Mar Individual Performance 400
Emp_301 2019 Mar Individual Performance 760
Emp_301 2018 Jul Company Performance 720
Emp_301 2018 Jan Company Performance 350
Emp_301 2018 Mar Individual Performance 350

Tableau result table using all three LOD Expressions:

Tableau LOD

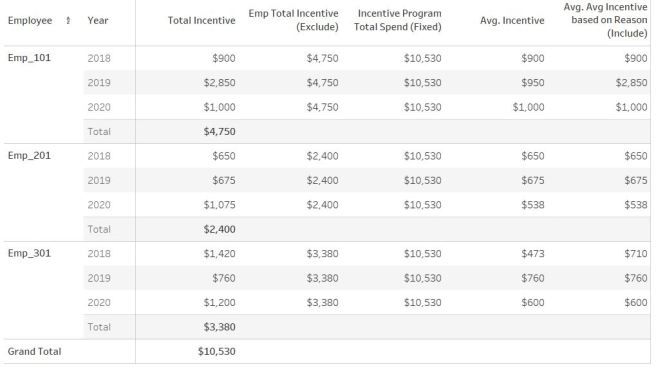
Calculations used in the above View:

Total Incentive – Sum(Incentive) – Regular Calculation which is influenced by dimensions in View or Worksheet

Emp Total Incentive (Exclude) – { EXCLUDE [Year]: SUM([Incentive]) } – Exclude Year dimension from the scope of SUM(Incentive) calculation

Incentive Program Total Spend (Fixed) – { FIXED : SUM([Incentive]) } – Fixing here the scope to global, it’ll not respond/get limited to any dimension used in this View or Worksheet

Avg Incentive – Avg(Incentive)

Avg Incentive based on Reason (Include) – { INCLUDE [Reason]: SUM([Incentive])} – Included additional dimension (Reason) to this calculation. The objective of this calculation was to find the Average of Incentive based on the reason types. Eg. Take a look at the Incentive amount (Source Data) for Emp_301 for 2018.  “Individual Performance” = 350 & “Company Performance” = 720 + 350 = 1070. Result for this calculation = 350 + 1070 /2 = 710, this is what you see in Tableau table chart above.

Hope this helps…

Tableau LOD Expression

Came across requirement to find the number of tickets worked by multiple support persons.

Especially opened New ticket by somebody and closed by another guy.

Created below dummy data to demonstrate it.


Date Ticket ID Support Person Status Business User Group
1/1/2019 101 Prabhu New Suman Sales
1/1/2019 101 Prabhu Inprogress Suman Sales
1/2/2019 101 Prabhu Closed Suman Sales
1/1/2019 201 Aditya New Evan Sales
1/2/2019 201 Prabhu Closed Evan Sales
1/1/2019 301 Subbu New Rob Sales
1/2/2019 301 Prabhu Closed Rob Sales
1/1/2019 401 Praveen New Rob Sales
1/2/2019 401 Subbu Closed Rob Sales
1/1/2019 501 Praveen New Rob Sales
1/2/2019 501 Subbu Closed Rob Sales

Loaded this data into a Tableau dashboard and created below calculated field.

Tickets worked by different Support Person: “IIF({FIXED [Ticket ID]: COUNTD(IIF([Status]=’New’ and [Status]=’Closed’, [Support Person], [Support Person]))}=2,1,0)”

This field can be used as filter or in appropriate marks of the worksheets.

Used the calculated field directly in table below just to show.

post1

Used in below bar chart too. 0 represents Tickets worked by just same person and 1 represents by different person.

Post2.JPG

Generic Image Thumbnails for a Workbook in Tableau Server

On the server where you publish, one of the options for browsing content is by thumbnail view. In this view, thumbnails are generated based on the workbook and its sheets. If your workbook contains user filter, you can specify which user’s filter to use for creating the thumbnails.
For example, if you want the thumbnail image to show all regions of a sales forecast, you can generate thumbnails per the user who is allowed to see all regions.
In the following scenarios, a generic image appears in place of the view thumbnail.
The user you select does not have permission to see the data.
The data is from a Tableau Server data source that was published with data source filters, user calculations, impersonation, or other user reference.

Tableau: BIGINT to DATE Conversion

Used below calculation to convert BigINT to Date for a Impala table.
Originally this Impala table was loaded from Oracle table by Sqoop. Sqoop converts Oracle date fields to BigInt fields.

Note: Parquet doesn’t support date type but it does support timestamp. Sqoop has some bug so it cannot do timestamp but there is two step workaround for this that’s how i end up in using Spark.

dateadd(‘second’, INT(([Start Date]/1000)+(8*60*60)-43200), #1970-01-01#)

Source: https://community.tableau.com/thread/163721

Tableau Server Caching Layers

Tableau Server caching operates with layered approach, it contains below four layers
1. Tile Cache
2. Model Cache
3. Abstract Cache
4. Query Cache

It goes in Top down fashion, if top layer is missed then it approaches subsequent layer.

**1. Tile Cache**
In general, dashboards are delivered to users as a series of Image “Tiles” – these are assembled to show the complete dashboard.

We can use this cache if:
Same dashboard
No per-user security
Same dashboard size (Important! Don’t miss reusing cache for simple reason)

Handled by the gateway service, one per VizQL worker node

**2. Model Cache**
When re-rendering the dashboard we check to see if computations have already be done
calculated fields, table calculations, reference lines, trend lines, etc
We can use this cache if:
No change to data
No change to calcs
Model cache is RAM based per VizQL server instance

**3. Query Result Cache**
The query result cache holds the results from queries we have sent to data sources

We can use this cache if:
Dimensions and measures are the same
Filters are the same – this means no per user security
Cache has not expired or is not explicitly bypassed

Query result cache is RAM based per VizQL server instance

Source: https://community.tableau.com/docs/DOC-1466

Column ordering in View Data Full data tab or download

Tableau orders the column Alphabetically based on the underlying table Field names.

1. Create a View with prefixes AA_,AB_ …etc. for the fields based on the order that is required.
2. Pull that view into Tableau and rename the fields as per reporting requirement.
3. Now the Full data tab/downloads will be ordered as per the requirement.
4. If any of the calculation need not show up in the Full data tab/downloads, just add simple table calculation function like “Calculation + (Index()-Index())”, it will automatically get discarded.

Note: Since we are creating View, we need not create a table with meaningless column names.

Does Tableau subscription help in warming up cache?

In Tableau community I frequently came across this tip for improving performance for the first user after data refresh so thought of checking its reliability and made sure, yes it does.

http://kb.tableau.com/articles/howto/warming-the-tableau-server-cache-using-subscriptions

Sometimes Tableau KB URLs are not working so I just copy-pasted below content from it.

Warming the Tableau Server Cache Using Subscriptions Published: 28 Apr 2015 Last Modified Date: 14 Nov 2016 Question How to improve workbook performance by warming the Tableau Server cache using subscriptions. Environment Tableau Server Answer Starting with Tableau Server 9.0, the Cache Server can be warmed with data using the Subscription function. Triggering a subscription email that includes a thumbnail after executing an extract refresh will cause the queries to run for the viz and load into the external query cache.

Example Use Case Scenario: a user wants a fast-loading view for an 8AM meeting. Tableau Administrator schedules an extract refresh at 2AM. Tableau Administrator schedules a subscription email at 5AM. User loads workbook quickly from stored cache. Note: if “Refresh More Often” is selected in the Data Connections tab of Configure Tableau Server, the cache be cleared every time the view is loaded. Additionally, regardless of cache setting, if a user hits the “Refresh Data” button on the toolbar, the Tableau Server will fetch new data.