Author: pramaraj0459
Install specific version of python in conda virtual environment
At times you may need to use different versions of python for your different projects. Happened with me too I had to use 3.10 for a project so I was able to manage with two below steps.
- conda activate environment_name
- conda install python=3.10
Fix for corrupted Tableau dashboard
Error Code: D2E8DA72
This document has no version number.

My situtation: Developed a Tableau dashboard spending lots of time using Tableau Public and when I tried to publish, it crashed and closed automatically without showing any prompts.
Steps taken:
Searched my computer and found Temp app created at ..\Users\AppData\Local\Temp\TableauTemp
When I tried to open that app I was prompted with above Error dialog. It was trying to open in Tableau desktop (not Public)
Then I tried with Tableau public desktop that didn’t work either but error message was different.

Resolution:
Then I took a copy of that Temp TWB in a different location and extracted it using 7-zip extractor.

A file (TWB) and a folder (Data) got extracted, twb file had the same name which I used initially.

Then I was able to open up the extracted TWB file with Tableau desktop (not Public). After opening I saved that file as packaged workbook and tried opening packaged workbook with Tableau Public desktop, this time it worked perfect.
Tableau Desktop/ Public Desktop Version: 2021.1.2
Tableau LOD explained with Simple example
Scope of any Calculations or Aggregate functions is limited to the dimensions that are used in the View or Worksheet. Tableau LOD feature is basically for overriding that limitation.
There are basically three types of LOD Expressions,
- Fixed – Fixing/Hard-coding the scope, not influenced by the dimensions in View or Worksheet
- Exclude – Exclude the granularity, used to get rid of one or more dimensions in View or Worksheet
- Include – Include the granularity, dimension which is not part of the View or Worksheet can still be added to the calculation using Include expression.
Enough theory, let’s jump on to a simple example.
Sample Data:
| Employee | Year | Cycle | Reason | Incentive |
| Emp_101 | 2020 | Jan | Company Performance | 1000 |
| Emp_101 | 2019 | Jan | Individual Performance | 950 |
| Emp_101 | 2019 | Mar | Individual Performance | 950 |
| Emp_101 | 2019 | Oct | Individual Performance | 950 |
| Emp_101 | 2018 | Jul | Company Performance | 900 |
| Emp_201 | 2020 | Jan | Company Performance | 700 |
| Emp_201 | 2020 | Mar | Individual Performance | 375 |
| Emp_201 | 2019 | Mar | Individual Performance | 675 |
| Emp_201 | 2018 | Jul | Individual Performance | 650 |
| Emp_301 | 2020 | Jan | Company Performance | 800 |
| Emp_301 | 2020 | Mar | Individual Performance | 400 |
| Emp_301 | 2019 | Mar | Individual Performance | 760 |
| Emp_301 | 2018 | Jul | Company Performance | 720 |
| Emp_301 | 2018 | Jan | Company Performance | 350 |
| Emp_301 | 2018 | Mar | Individual Performance | 350 |
Tableau result table using all three LOD Expressions:
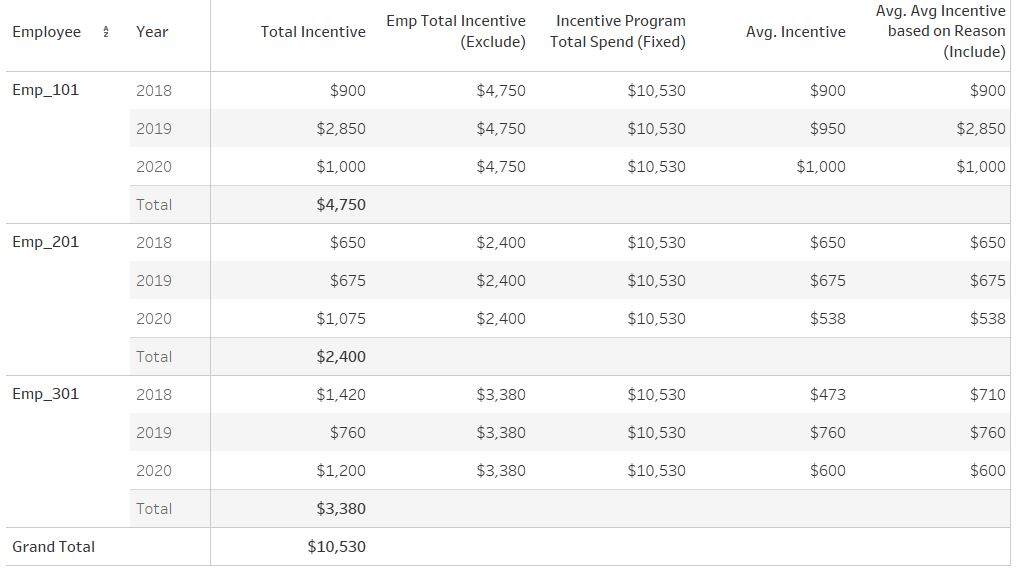
Calculations used in the above View:
Total Incentive – Sum(Incentive) – Regular Calculation which is influenced by dimensions in View or Worksheet
Emp Total Incentive (Exclude) – { EXCLUDE [Year]: SUM([Incentive]) } – Exclude Year dimension from the scope of SUM(Incentive) calculation
Incentive Program Total Spend (Fixed) – { FIXED : SUM([Incentive]) } – Fixing here the scope to global, it’ll not respond/get limited to any dimension used in this View or Worksheet
Avg Incentive – Avg(Incentive)
Avg Incentive based on Reason (Include) – { INCLUDE [Reason]: SUM([Incentive])} – Included additional dimension (Reason) to this calculation. The objective of this calculation was to find the Average of Incentive based on the reason types. Eg. Take a look at the Incentive amount (Source Data) for Emp_301 for 2018. “Individual Performance” = 350 & “Company Performance” = 720 + 350 = 1070. Result for this calculation = 350 + 1070 /2 = 710, this is what you see in Tableau table chart above.
Hope this helps…
Inventor
William Playfair invented the line, bar, area, and pie charts.
Data Modeling Blog Posts
https://www.talend.com/blog/2017/05/05/data-model-design-best-practices-part-1/
https://www.talend.com/blog/2017/07/31/data-model-design-best-practices-part-2/
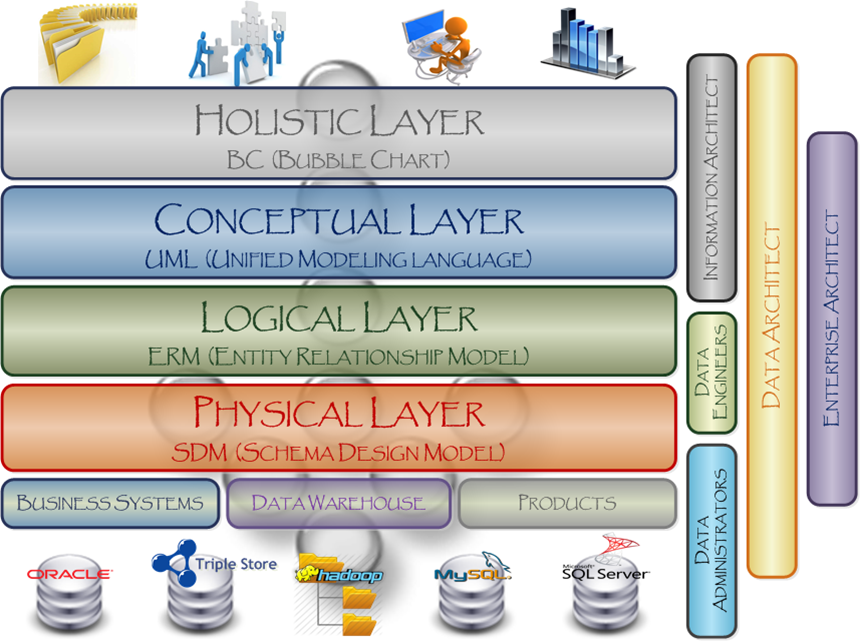
| DATA MODEL ASPECT | HOLISTIC | CONCEPTUAL | LOGICAL | PHYSICAL |
| Data Silos | √ | |||
| Data Silo Relationships | √ | |||
| Element Names | √ | |||
| Element Relationships | √ | |||
| Element Generalizations | √ | |||
| Element Items | √ | |||
| Entity Names | √ | |||
| Entity Relationships | √ | |||
| Entity Keys | √ | |||
| Entity Attributes | √ | |||
| Entity Constraints | √ | |||
| Table / View Names | √ | |||
| Column Names | √ | |||
| Column Data Types | √ | |||
| Column Default Values | √ | |||
| Primary / Foreign Keys | √ | |||
| Index Names | √ | |||
| Index Properties | √ | |||
| Storage Configurations | √ |
Tableau Colors
Below are my favorite color combination for Dashboards.
Fonts – RGB(235,235,235)
Dark Background – RGB(50,51,52)
Tableau LOD Expression
Came across requirement to find the number of tickets worked by multiple support persons.
Especially opened New ticket by somebody and closed by another guy.
Created below dummy data to demonstrate it.
| Date | Ticket ID | Support Person | Status | Business User | Group |
| 1/1/2019 | 101 | Prabhu | New | Suman | Sales |
| 1/1/2019 | 101 | Prabhu | Inprogress | Suman | Sales |
| 1/2/2019 | 101 | Prabhu | Closed | Suman | Sales |
| 1/1/2019 | 201 | Aditya | New | Evan | Sales |
| 1/2/2019 | 201 | Prabhu | Closed | Evan | Sales |
| 1/1/2019 | 301 | Subbu | New | Rob | Sales |
| 1/2/2019 | 301 | Prabhu | Closed | Rob | Sales |
| 1/1/2019 | 401 | Praveen | New | Rob | Sales |
| 1/2/2019 | 401 | Subbu | Closed | Rob | Sales |
| 1/1/2019 | 501 | Praveen | New | Rob | Sales |
| 1/2/2019 | 501 | Subbu | Closed | Rob | Sales |
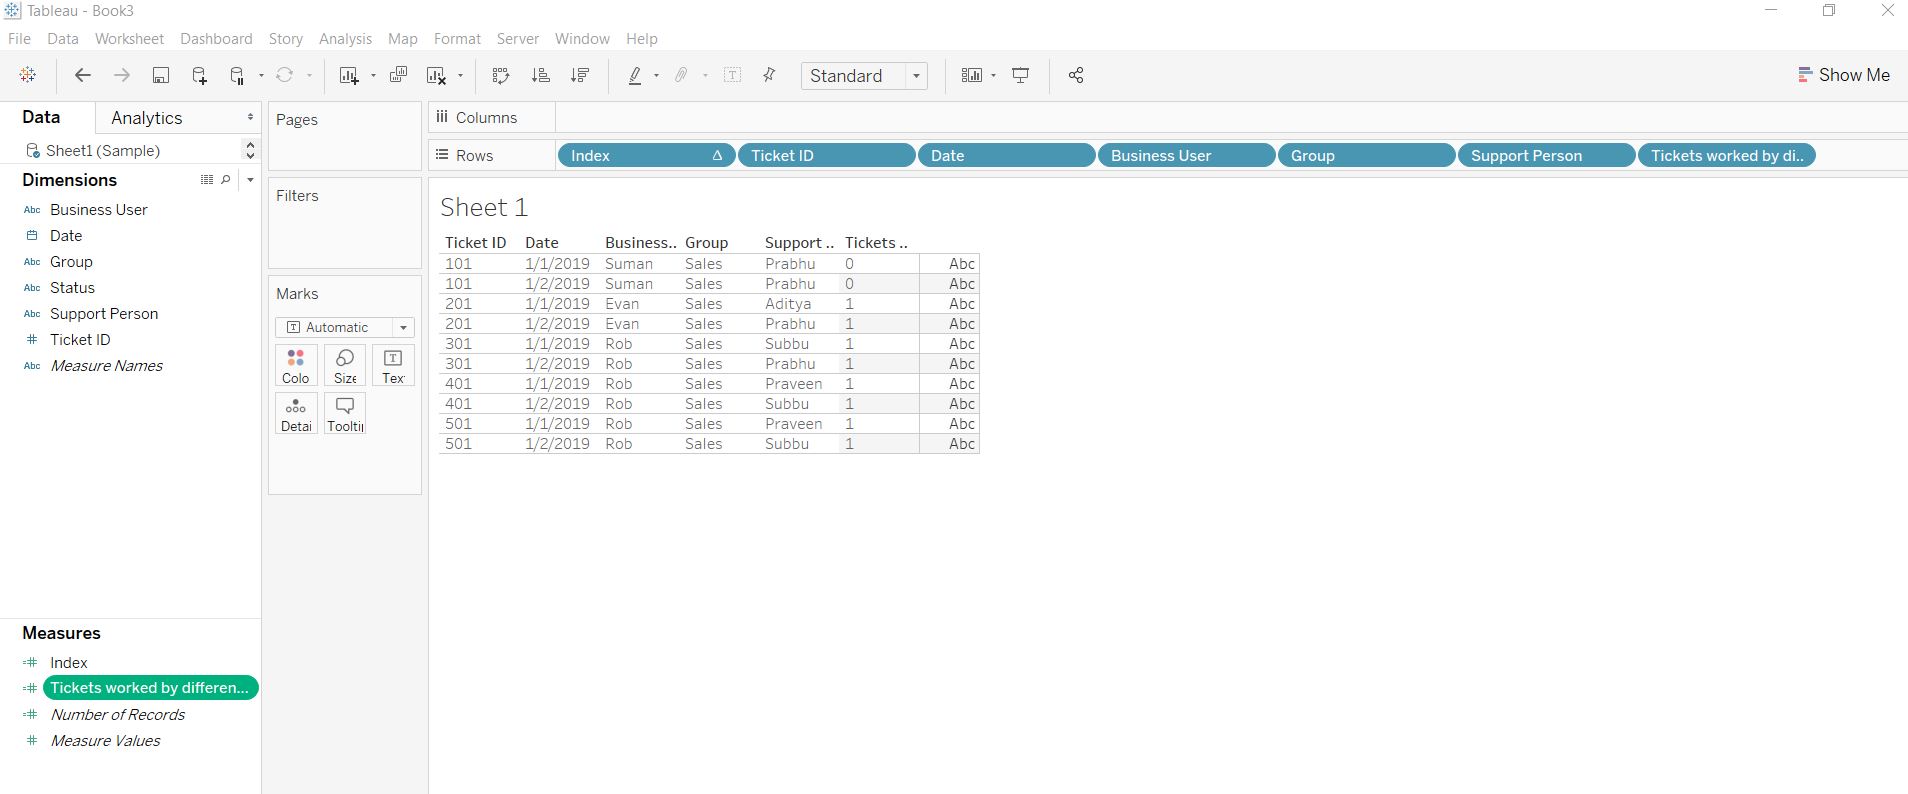
Loaded this data into a Tableau dashboard and created below calculated field.
Tickets worked by different Support Person: “IIF({FIXED [Ticket ID]: COUNTD(IIF([Status]=’New’ and [Status]=’Closed’, [Support Person], [Support Person]))}=2,1,0)”
This field can be used as filter or in appropriate marks of the worksheets.
Used the calculated field directly in table below just to show.
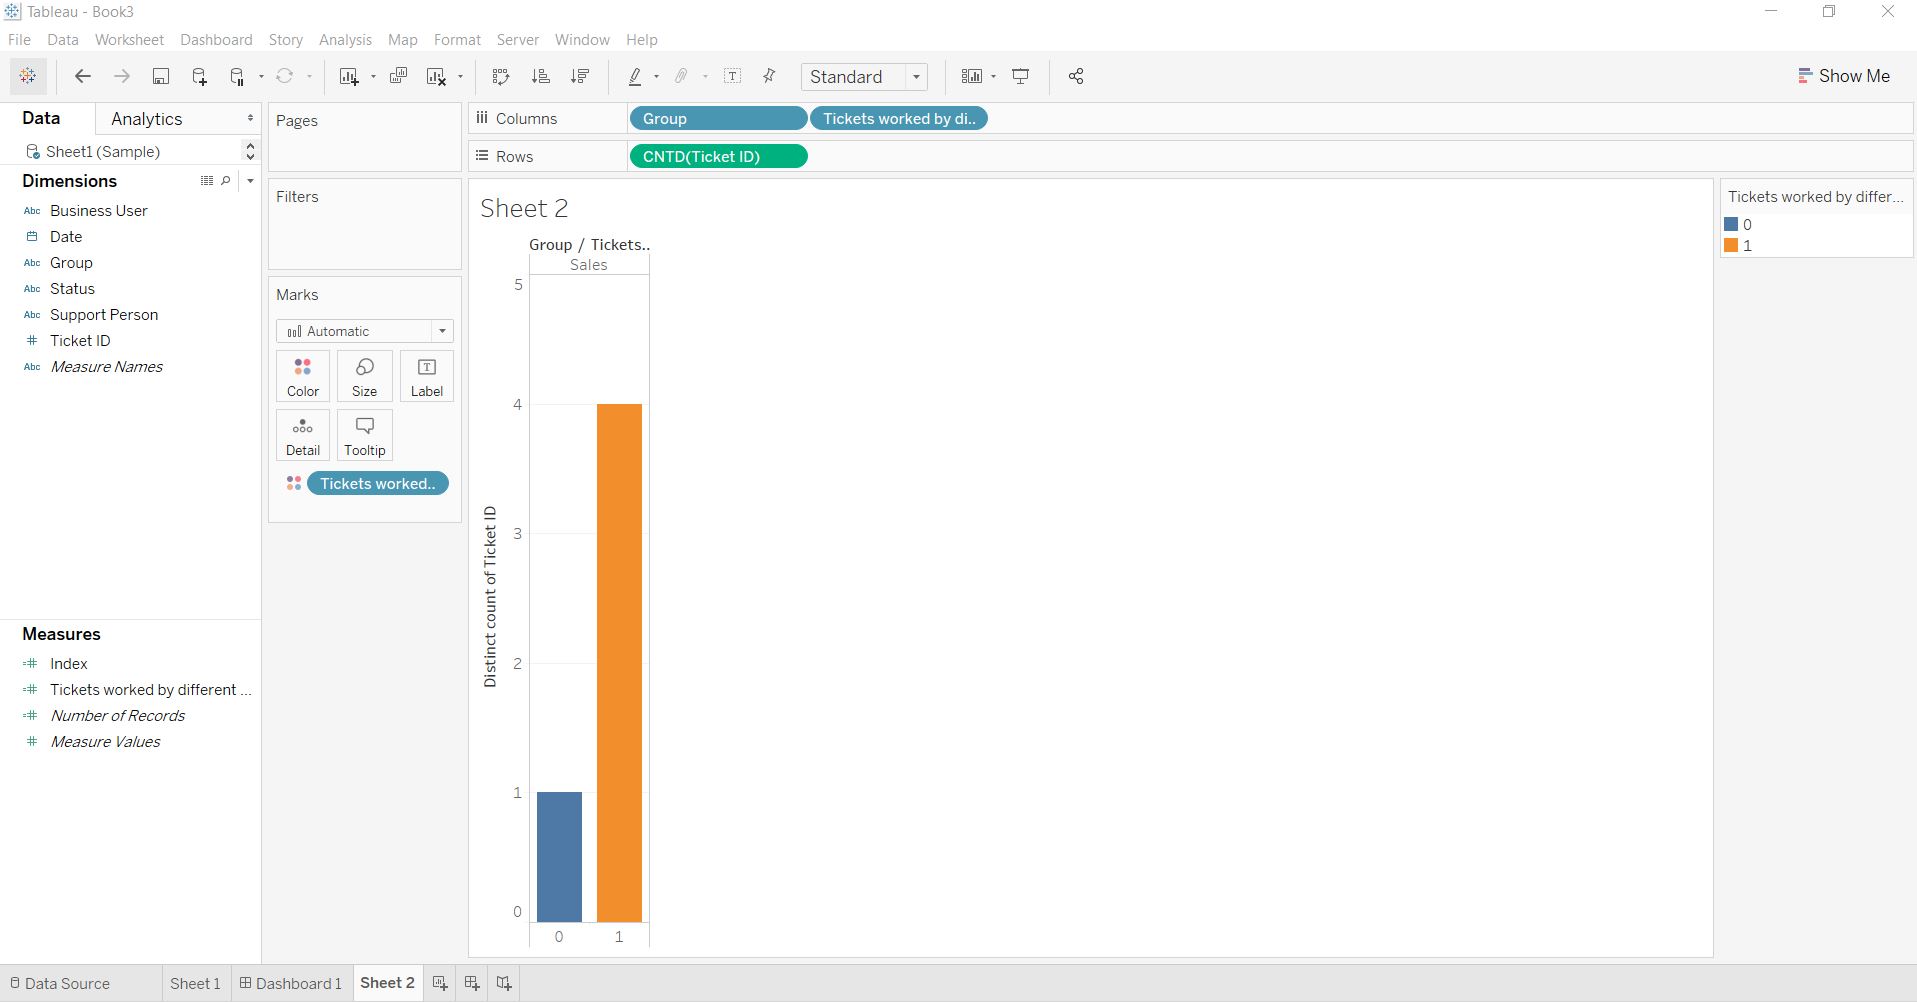
Used in below bar chart too. 0 represents Tickets worked by just same person and 1 represents by different person.
–map-column-hive is getting ignore in sqoop 1.4.6
sqoop import -D mapred.job.queue.name=root.ficc.qar -D mapreduce.map.memory.mb=3072 -D mapreduce.map.java.opts=-Xmx3072m –connect “jdbc:oracle:thin:@servername.corp.company.com:40000/DB_ServiceName” –table EMPLOYEE –username USERNAME –password-file /user/id/pwd –split-by JOINDATE -m 1 –hive-import –hive-database hiveDB –hive-table EMPLOYEE –map-column-hive ID=INT64,NAME=VARCHAR,DEPARTMENT=VARCHAR,JOINDATE=TIMESTAMP –compress –compression-codec org.apache.hadoop.io.compress.SnappyCodec –as-parquetfile
Hive> describe Employee;
Name Type
1 id string
2 name string
3 department string
4 joindate bigint
Generic Image Thumbnails for a Workbook in Tableau Server
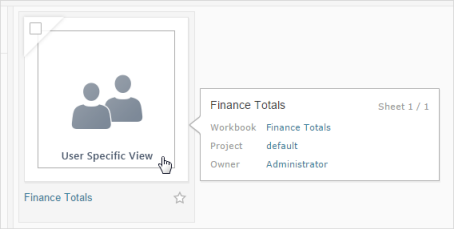
On the server where you publish, one of the options for browsing content is by thumbnail view. In this view, thumbnails are generated based on the workbook and its sheets. If your workbook contains user filter, you can specify which user’s filter to use for creating the thumbnails.
For example, if you want the thumbnail image to show all regions of a sales forecast, you can generate thumbnails per the user who is allowed to see all regions.
In the following scenarios, a generic image appears in place of the view thumbnail.
The user you select does not have permission to see the data.
The data is from a Tableau Server data source that was published with data source filters, user calculations, impersonation, or other user reference.
