Below are my favorite color combination for Dashboards.
Fonts – RGB(235,235,235)
Dark Background – RGB(50,51,52)
To share our learnings on QlikView and Tableau
Below are my favorite color combination for Dashboards.
Fonts – RGB(235,235,235)
Dark Background – RGB(50,51,52)
Came across requirement to find the number of tickets worked by multiple support persons.
Especially opened New ticket by somebody and closed by another guy.
Created below dummy data to demonstrate it.
| Date | Ticket ID | Support Person | Status | Business User | Group |
| 1/1/2019 | 101 | Prabhu | New | Suman | Sales |
| 1/1/2019 | 101 | Prabhu | Inprogress | Suman | Sales |
| 1/2/2019 | 101 | Prabhu | Closed | Suman | Sales |
| 1/1/2019 | 201 | Aditya | New | Evan | Sales |
| 1/2/2019 | 201 | Prabhu | Closed | Evan | Sales |
| 1/1/2019 | 301 | Subbu | New | Rob | Sales |
| 1/2/2019 | 301 | Prabhu | Closed | Rob | Sales |
| 1/1/2019 | 401 | Praveen | New | Rob | Sales |
| 1/2/2019 | 401 | Subbu | Closed | Rob | Sales |
| 1/1/2019 | 501 | Praveen | New | Rob | Sales |
| 1/2/2019 | 501 | Subbu | Closed | Rob | Sales |
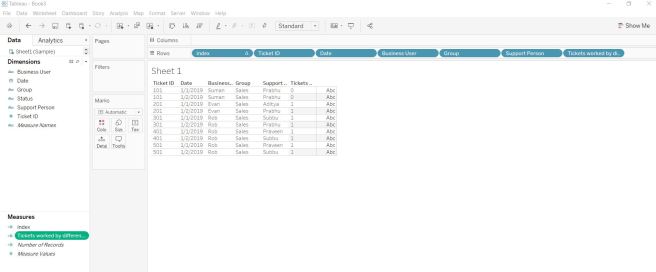
Loaded this data into a Tableau dashboard and created below calculated field.
Tickets worked by different Support Person: “IIF({FIXED [Ticket ID]: COUNTD(IIF([Status]=’New’ and [Status]=’Closed’, [Support Person], [Support Person]))}=2,1,0)”
This field can be used as filter or in appropriate marks of the worksheets.
Used the calculated field directly in table below just to show.
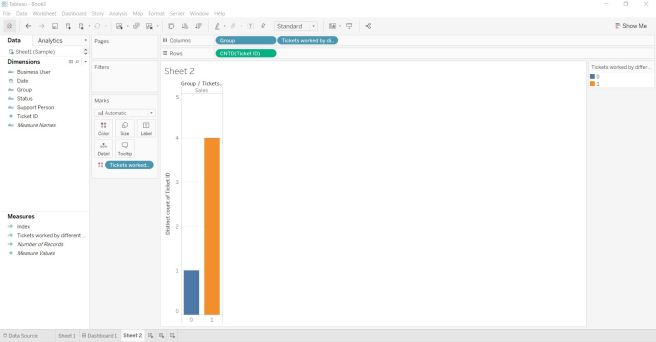
Used in below bar chart too. 0 represents Tickets worked by just same person and 1 represents by different person.
sqoop import -D mapred.job.queue.name=root.ficc.qar -D mapreduce.map.memory.mb=3072 -D mapreduce.map.java.opts=-Xmx3072m –connect “jdbc:oracle:thin:@servername.corp.company.com:40000/DB_ServiceName” –table EMPLOYEE –username USERNAME –password-file /user/id/pwd –split-by JOINDATE -m 1 –hive-import –hive-database hiveDB –hive-table EMPLOYEE –map-column-hive ID=INT64,NAME=VARCHAR,DEPARTMENT=VARCHAR,JOINDATE=TIMESTAMP –compress –compression-codec org.apache.hadoop.io.compress.SnappyCodec –as-parquetfile
Hive> describe Employee;
Name Type
1 id string
2 name string
3 department string
4 joindate bigint
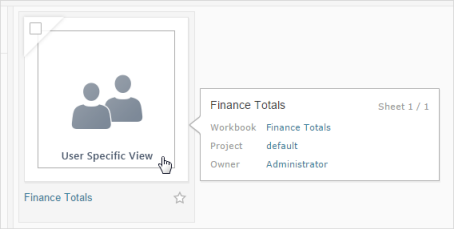
On the server where you publish, one of the options for browsing content is by thumbnail view. In this view, thumbnails are generated based on the workbook and its sheets. If your workbook contains user filter, you can specify which user’s filter to use for creating the thumbnails.
For example, if you want the thumbnail image to show all regions of a sales forecast, you can generate thumbnails per the user who is allowed to see all regions.
In the following scenarios, a generic image appears in place of the view thumbnail.
The user you select does not have permission to see the data.
The data is from a Tableau Server data source that was published with data source filters, user calculations, impersonation, or other user reference.
https://impala.apache.org/docs/build/html/topics/impala_file_formats.html#file_formats
Default file format for Impala create table is text
SELECT *

FROM Oracle_Table

WHERE (LENGTH(Parameter_name)=3 OR LENGTH(Parameter_name)=5)

// length on input has to either 3 or 5 for this query to work

AND Oracle_Field LIKE  || '%'
Used below calculation to convert BigINT to Date for a Impala table.
Originally this Impala table was loaded from Oracle table by Sqoop. Sqoop converts Oracle date fields to BigInt fields.
Note: Parquet doesn’t support date type but it does support timestamp. Sqoop has some bug so it cannot do timestamp but there is two step workaround for this that’s how i end up in using Spark.
dateadd(‘second’, INT(([Start Date]/1000)+(8*60*60)-43200), #1970-01-01#)
Ctrl + 0 + 0 will create quick dummy data in Qlik Sense
It’s like Ctrl + q + q for QlikView.
