Scope of any Calculations or Aggregate functions is limited to the dimensions that are used in the View or Worksheet. Tableau LOD feature is basically for overriding that limitation.
There are basically three types of LOD Expressions,
- Fixed – Fixing/Hard-coding the scope, not influenced by the dimensions in View or Worksheet
- Exclude – Exclude the granularity, used to get rid of one or more dimensions in View or Worksheet
- Include – Include the granularity, dimension which is not part of the View or Worksheet can still be added to the calculation using Include expression.
Enough theory, let’s jump on to a simple example.
Sample Data:
| Employee | Year | Cycle | Reason | Incentive |
| Emp_101 | 2020 | Jan | Company Performance | 1000 |
| Emp_101 | 2019 | Jan | Individual Performance | 950 |
| Emp_101 | 2019 | Mar | Individual Performance | 950 |
| Emp_101 | 2019 | Oct | Individual Performance | 950 |
| Emp_101 | 2018 | Jul | Company Performance | 900 |
| Emp_201 | 2020 | Jan | Company Performance | 700 |
| Emp_201 | 2020 | Mar | Individual Performance | 375 |
| Emp_201 | 2019 | Mar | Individual Performance | 675 |
| Emp_201 | 2018 | Jul | Individual Performance | 650 |
| Emp_301 | 2020 | Jan | Company Performance | 800 |
| Emp_301 | 2020 | Mar | Individual Performance | 400 |
| Emp_301 | 2019 | Mar | Individual Performance | 760 |
| Emp_301 | 2018 | Jul | Company Performance | 720 |
| Emp_301 | 2018 | Jan | Company Performance | 350 |
| Emp_301 | 2018 | Mar | Individual Performance | 350 |
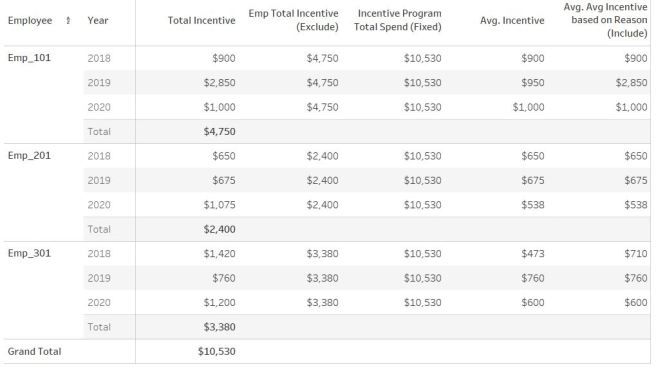
Tableau result table using all three LOD Expressions:

Calculations used in the above View:
Total Incentive – Sum(Incentive) – Regular Calculation which is influenced by dimensions in View or Worksheet
Emp Total Incentive (Exclude) – { EXCLUDE [Year]: SUM([Incentive]) } – Exclude Year dimension from the scope of SUM(Incentive) calculation
Incentive Program Total Spend (Fixed) – { FIXED : SUM([Incentive]) } – Fixing here the scope to global, it’ll not respond/get limited to any dimension used in this View or Worksheet
Avg Incentive – Avg(Incentive)
Avg Incentive based on Reason (Include) – { INCLUDE [Reason]: SUM([Incentive])} – Included additional dimension (Reason) to this calculation. The objective of this calculation was to find the Average of Incentive based on the reason types. Eg. Take a look at the Incentive amount (Source Data) for Emp_301 for 2018. “Individual Performance” = 350 & “Company Performance” = 720 + 350 = 1070. Result for this calculation = 350 + 1070 /2 = 710, this is what you see in Tableau table chart above.
Hope this helps…